BlueM.Wave: Difference between revisions
(→Edit & Analyze: added Calculation analysis function) |
(→Development: Link to release notes on download page) |
||
| Line 97: | Line 97: | ||
==Development== | ==Development== | ||
* [[Wave:Code|Code documentation]] | * [[Wave:Code|Code documentation]] | ||
* [ | * [https://downloads.bluemodel.org/BlueM.Wave/BlueM.Wave_Release-notes.txt Release Notes] | ||
* [http://bugs.bluemodel.org/buglist.cgi?bug_status=UNCONFIRMED&bug_status=NEW&bug_status=ASSIGNED&bug_status=REOPENED&content=&product=Wave&query_format=specific&order=bug_severity%2Cpriority%20ASC&query_based_on= Bugzilla:Wave] | * [http://bugs.bluemodel.org/buglist.cgi?bug_status=UNCONFIRMED&bug_status=NEW&bug_status=ASSIGNED&bug_status=REOPENED&content=&product=Wave&query_format=specific&order=bug_severity%2Cpriority%20ASC&query_based_on= Bugzilla:Wave] | ||
[[Category:BlueM.Wave]] | [[Category:BlueM.Wave]] | ||
Revision as of 02:40, 7 September 2021
 Wave | Download | Development
Description
Wave is a tool for displaying, analyzing and importing and exporting time series.
Features
Supported formats
- WEL (BlueM, GISMO, TALSIM, Hystem-Extran)
- ZRE
- ASC
- SMB
- REG (SMUSI and Hystem-Extran)
- OUT (SWMM
- PRMS result files
- TXT (SWMM routing interface files)
- UVF (Universelles Variables Format)
- HYDRO_AS-2D result files
- BIN (SYDRO binary format)
- ZRXP (ZXRP format)
- and generic text files (e.g. CSV)
Use a Wave project file (*.wvp) to quickly import multiple series from multiple files at once.
Drag&Drop files onto Wave to import them quickly.
It is also possible to manually input time series, or use copy & paste from Excel.
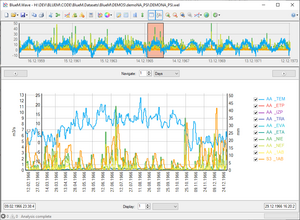
Display time series in a highly customizable diagram (provided by TeeChart)
- Overview: An overview chart shows you the full extent of the time series and the period currently displayed in the main diagram.
- Axes: When importing time series, series are automatically assigned to different axes depending on their unit.
- Zoom & pan: Use the mouse to zoom or pan.
- Navigation bar: Use the navigation bar to set a custom display period and to navigate by a fixed time period.
- Quickly switch time series on and off using the check boxes in the legend.
Save & Export
Save diagrams to the native TeeChart format (TEN-File) to preserve all data and formatting (for exceptions, see known issues below).
Export diagrams as image files (PNG, JPG, BMP)
Export time series to the following formats:
Edit & Analyze
Editing functions:
- Cut time series to a specified time period or to another series' extent
- Convert error values of a time series
- Merge multiple time series into one while respecting priorities
Analysis functions:
- Annual statistics: Compute various statistical parameters (min, max, average) of a time series
- Calculator: Performs a mathematical operation on one or more time series
- ChangeTimestep: Make a time series equidistant with a user-specified timestep
- Comparison: Plot two time series against each other and compute a linear regression line
- Cumulative: Compute a new time series that contains the cumulative values of the original series
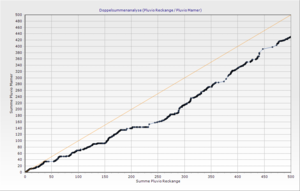
- Double sum curve
- Goodness of fit (volume error, sum of squares error, Nash-Sutcliffe efficiency, etc.)
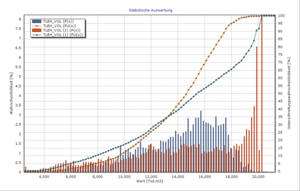
- Histogram
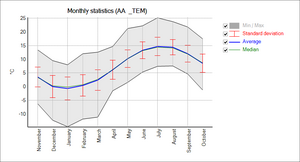
- Monthly statistics
- Timestep analysis: Calculate the timestep between nodes in a user-specified unit
API
The API is used by BlueM.Opt and BlueM.Win.
See the documentation.
Notes
Error values
- "NaN", "Infinity" and "-Infinity" in import files are recognized and accepted.
- Unreadable values are converted to NaN during import.
- If a file format has a specified error value (e.g. -777 for ZRXP and UVF), then any corresponding entries are also converted to NaN.
- NaN values are displayed as gaps in the chart and are ignored when performing analysis functions.
- Custom, user-specified values can be converted to NaN after import.
- NaN values can be visualized in the chart by pressing a button (see screenshot to the right).
Volume property
Wave calculates and displays the volume of a time series (e.g. for GoodnessOfFit analysis or in the properties window), if a time series' unit ends with "/s" (e.g. "m³/s"), by integrating the values over time. Time series with other units only have the Sum property.
Downloads
Please refer to the Download page.
Known Issues
When saving a chart to the native TEN format of TeeChart, any NaN values contained in the series are lost (i.e. the nodes with the NaN values are omitted from the series).fixed in v1.9.1


