Wave:DoubleSumCurve
Jump to navigation
Jump to search
 Wave | Download | Development
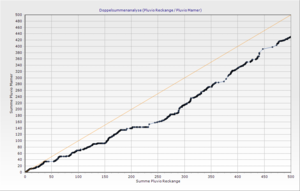
This analysis function plots the cumulative coincident values of two time series against each other and adds a 45° line to the resulting plot.
Notes:
- The two time series should have the same time step
- Only coincident nodes where both time series values are not NaN are considered
