Wave:AnnualStatistics
Jump to navigation
Jump to search
 Wave | Download | Development
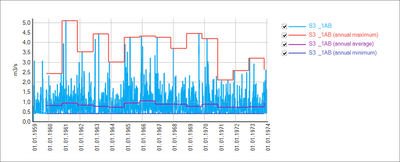
This analysis function calculates annual statistics of a time series (min, max, avg, vol) based on user-defined hydrological years.
The results are returned as a table of list-separated values in the log.
Annual bounding box series of annual maximum, average and minimum values can be generated optionally.
Example:
  Description;Start;End;Length;Min;Max;Avg;Volume
  Entire series;02.01.1959 00:00;31.12.1973 00:00;5478.0000;0.0840;1.5850;0.1553;73500868.8000
  1959;02.01.1959 00:00;01.11.1959 00:00;304.0000;0.0840;0.7690;0.1330;3482049.6000
  1960;01.11.1959 00:00;01.11.1960 00:00;367.0000;0.0840;0.6780;0.1612;5089867.2000
  1961;01.11.1960 00:00;01.11.1961 00:00;366.0000;0.0840;1.5850;0.1807;5694192.0000
  1962;01.11.1961 00:00;01.11.1962 00:00;366.0000;0.0840;1.0250;0.1616;5100321.6000
  1963;01.11.1962 00:00;01.11.1963 00:00;366.0000;0.0840;1.0430;0.1517;4787683.2000
  1964;01.11.1963 00:00;01.11.1964 00:00;367.0000;0.0840;0.9450;0.1461;4623696.0000
  1965;01.11.1964 00:00;01.11.1965 00:00;366.0000;0.0840;1.1570;0.1789;5647233.6000
  1966;01.11.1965 00:00;01.11.1966 00:00;366.0000;0.0840;1.1100;0.1819;5741064.0000
  1967;01.11.1966 00:00;01.11.1967 00:00;366.0000;0.0840;0.9350;0.1593;5018932.8000
  1968;01.11.1967 00:00;01.11.1968 00:00;367.0000;0.0840;0.7040;0.1591;5027227.2000
  1969;01.11.1968 00:00;01.11.1969 00:00;366.0000;0.0840;1.2380;0.1405;4436294.4000
  1970;01.11.1969 00:00;01.11.1970 00:00;366.0000;0.0840;1.1820;0.1603;5061268.8000
  1971;01.11.1970 00:00;01.11.1971 00:00;366.0000;0.0840;0.5390;0.1298;4096612.8000
  1972;01.11.1971 00:00;01.11.1972 00:00;367.0000;0.0840;0.8290;0.1354;4286044.8000
  1973;01.11.1972 00:00;01.11.1973 00:00;366.0000;0.0840;0.7680;0.1409;4448044.8000
  1974;01.11.1973 00:00;31.12.1973 00:00;61.0000;0.0840;0.7110;0.1836;960336.0000
