Wave:Histogram
Jump to navigation
Jump to search
 Wave | Download | Development
Description
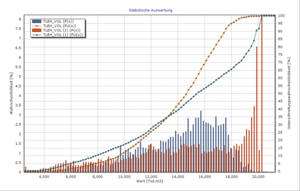
The analysis function Histogram divides the entire range of values into a series of user-defined intervals (bins) and then counts how many values fall into each interval. The result diagram contains the following:
- Probability (
P(x) = frequency / total amount) - Probability of subceedance (
PU(x) = cumulative frequency / total amount)
- Remarks
- You can only analyse multiple series at the same time if they use the same unit
