Rural Catchments
{{#hierarchy-top:}}
The natural process leading from rain to run-off is divided into three phases. The phases are Belastungsbildung, run-off generation (bzw. Belastungsaufteilung) and run-off concentration. The calculation approach for each of these phases is described in the following sections of this article.
Belastungsbildung
Die Belastungsbildung describes the determination of an areal rainfall for the considered catchment.Rainfall data is imported into BlueM via external time series. Therefore no explicit calculations are necessary for this phase.
Run-off generation
In this phase surface run-off, infiltration, evaporation and interflow are determined by calculating the effective rainfall out of the fallen rain. Snow is calculated for temperatures below 0°C. The Snow-Compaction-Method Knauf[1] is applied.
Rainfall (system load) is divided into rainfall which directly generates run-off and run-off diminishing losses (wetting, trough, evaporation and infiltration losses). Therefore this phase is also called the Belastungsaufteilung. The mathematical equation for the momentary Belastungsaufteilung is as follows:
- [math]\displaystyle{ Nw(t) = N(t) - VP(t) - I(t) - \frac{dO}{dt} - \frac{dS}{dt} }[/math]
- mit:
- NW = run-off generating rainfall
- N = rainfall
- VP = potential evaporation
- I = infiltration into the soil
- O = surfacce water reservoir content
- S = snow reservoir content
The individual elements of the equation and the calculation of these elements is described in the following.
Rainfall N(t)
BlueM requires rainfall data in form of rain time series. In general is does not matter if a block rain, Regenspektrum or a longtime rainfall time series. Depending on the purpose of the simulation the appropriate load (type) must be chosen. Rainfall time series originate out of the BlueM time series management or are created immediately before simulation begin as is the case for short term prediction by supplying a rainfall duration, rainfall height and choosing a model rainfall .
Evaporation VP(t)
There are two possibilities for the input of potential evaporation:
a) annual evaporation

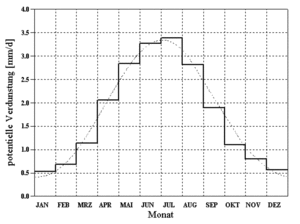
A normed annual pattern of potential evaporation according to Brandt[2] is utilized for the calculation of potential evaporation. Through the evaluation of measurements from twenty different stations, whichs mean-values are depicted as a histogram in Abbildung 33, the following smoothing function was derived (doted line in Abbildung 33):
- [math]\displaystyle{ VP[\mbox{mm/d}] = \begin{cases}(0.96 + 0.0033 \cdot i) \cdot \sin(\frac{2 \pi}{365})(i - 148) + 1.58, & i \lt = 300 \\ 2.56 - 1.53 / 65. \cdot (i - 300.), & i \gt 300 \end{cases} }[/math]
- ´with
- i = ongoing day of the hydrological year
- i = 1 → 1. November
Potential evaporation according to Brandt refers to grass reference evaporation[3] and assumes an annual total evaporation loss of 654,282 mm. If a different annual total evaporation loss is entered, the value determined by Brandt is scaled accordingly.
b) evaporation time series
If a evaporation time series is supplied the utilized time step is imported.
Attention: For time steps < 1 day the time series value is additionally overprinted with a daily pattern! (Bug 1)
daily pattern of evaporation
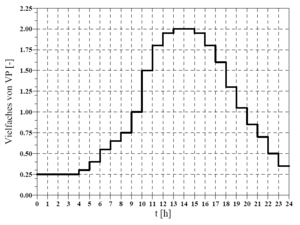
If the chosen time step for the calculation is < 1 day the potential evaporation for each time step is calculated by taking the daily pattern depicted in Abbildung 34 into consideration. If the chosen time step is ≥ 1 day the daily pattern is disregarded.
Surface water reservoir content(fraction of impervious area) O
Snow reservoir content as well as infiltration can be neglected for impervious areas. Therefore the equation of balance is reduced to:
- [math]\displaystyle{ Nw(t) = N(t) - VP(t) - \frac{dO}{dt} }[/math]
in which the change in surface water reservoir content dO/dt represents wetting of the surface as well as filling and depletion of water (through evaporation) in troughs.
The wetting loss (BV) for impervious areas is set to the following standard value.
BV = 0.5 mm
Trough loss (MV) is set by the user in the ALL-File.
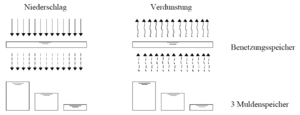
The trough loss is the mean value for an inclined surface. Due to the fact that troughs are not evenly distributed and experience has shown that run-off occurs before all troughs are completely filled the following assumption is made, that:
- 1/3 of the impervious area has a reduced trough loss of 1/3 MV
- 1/3 of the impervious area has a mean trough loss of 3/3 MV
- 1/3 of the impervious area has a elevated trough loss of 5/3 MV
. Therefore run-off occurs as soon as the rainfall (reduced by evaporation) is greater than wetting losses and 1/3 of the trough losses (in dry antecedent conditions). In Abbildung 35 the assumptions are depicted schematically.
Der Abflussbeiwert der versiegelten Flächen (nach Abdeckung der Anfangsverluste) wird mit ψ = 1 angesetzt. Bei der Festlegung des versiegelten Flächenanteils in einem Teileinzugsgebiet ist zu beachten, dass nicht alle befestigten oder versiegelten Flächen tatsächlich in eine Kanalisation entwässern.
Die kontinuierliche Bereitstellung der Benetzungs- und Muldenverluste erfolgt über die laufende Bilanzierung dieser Speicher und der Verdunstung.
Oberflächenwasservorrat (unversiegelter Flächenanteil) O
Der Oberflächenwasservorrat wird über die Bilanzierung eines Verlustspeichers in Abhängigkeit des gewählten Abflussbildungsansatzes berechnet. Einzelheiten dazu finden sich in den folgenden Abschnitten zur Berechnung der Infiltration bzw. abflusswirksamer Niederschlag.
Infiltration bzw. abflusswirksamer Niederschlag I(t), Nw(t)
Bei den durchlässigen Flächen kann die Infiltration in den Boden nicht vernachlässigt werden, da diese das Abflussgeschehen entscheidend prägt. Für die Berechnung wurden drei Ansätze im Modell implementiert:
- Konstanter Abflussbeiwert ψ
- Ereignisspezifischer Abflussbeiwert in Anlehnung an das Verfahren des Soil-Conservation-Service (SCS)
- Bodenfeuchtesimulation
Konstanter Abflussbeiwert ψ
Bei Angabe eines ψu-Wertes kommt nach Abdeckung der Anfangsverluste (Benetzungs- und Muldenverlust) der übrige Anteil des Niederschlages im Verhältnis des Abflussbeiwertes ψu zum Abfluss und zwar unabhängig von der Vorgeschichte und den Merkmalen des Niederschlages (Höhe, Intensität, Dauer). Auf diesen Ansatz sollte nach Möglichkeit verzichtet werden, da hier der Prozess der Abflussbildung nur grob vereinfachend beschrieben wird.
SCS-Verfahren
- siehe SCS-Verfahren
Bodenfeuchtesimulation
- siehe Bodenfeuchtesimulation
Abflusskonzentration
Die Abflusskonzentration bestimmt die Verzögerung des Abflusses aus dem Einzugsgebiet. Die Berechnung von Interflow und Basisabfluss ist abhängig vom Berechnungsansatz. Bei der Berechungsoption Bodenfeuchteberechnung werden die beiden Abflusskomponenten über einen linearen Einzelspeicher verzögert an den Elementausgang abgegeben. Bei den Berechungsoptionen Abflussbeiwert und SCS-Verfahren wird kein Interflow berücksichtigt und der Basisabfluss entsprechend der angegebenen Basisabflussspende unter möglicher Berücksichtigung eines Jahresgangs ermittelt.
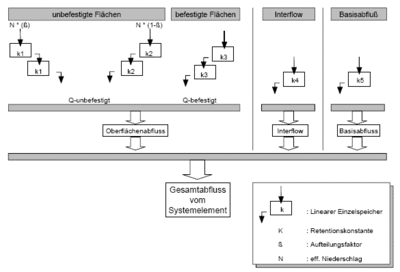
Es wird eine Parallelspeicherkaskade mit jeweils zwei Speichern für unbefestigte und eine Kaskade mit ebenfalls zwei Speichern für befestigte Flächen benutzt. Die Speicherkaskaden können entweder als Linearspeicher oder als nichtlineare Speicher berechnet werden. Werden die Parameter für die Speicherkaskade nicht vorgegeben, erfolgt die Berchenung an Hand der Gebietskenngrößen gemäß Zaiß (1986)[4].
Literaturangaben
- ↑ Knauf, D. (1980): Die Berechnung des Abflusses aus einer Schneedecke, in: DVWK-Schriften, Heft 46, Analyse und Berechnung oberirdischer Abflüsse PDF

- ↑ 2.0 2.1 Brandt, T. (1979): Modell zur Abflussgangliniensimulation unter Berücksichtigung des grundwasserbürtigen Abflusses, Technischer Bericht Nr. 24 aus dem Institut für Wasserbau, Fachgebiet Ingenieurhydrologie und Hydraulik der TH Darmstadt
- ↑ DVWK (Hrsg.) (1996): Ermittlung der Verdunstung von Land- und Wasserflächen, DVWK-Merkblätter zur Wasserwirtschaft, Heft 238. Bonn: Wirtschafts- und Verlagsgesellschaft Gas und Wasser mbH
- ↑ Zaiß, H. (1986): Abflussermittlung aus Teilflächen, in "Hydrologische Abflussmodelle in der praktischen Anwendung", 36. Fortbildungslehrgang des BWK-Hessen am 21. März 1986, Friedberg [ihwb-Bibliothek: Inv.-Nr. 5593, 10 BWK 36] PDF
 OCR
OCR 
{{#hierarchy-bottom:}}


