Urban Catchments: Difference between revisions
mNo edit summary |
(Description of SCS-Method deleted, instead linked to SCS article) |
||
| Line 114: | Line 114: | ||
By supplying a ψ<sub>u</sub>-value the remaining rainfall after having covered the initial losses (wetting and trough losses) generates run-off according to the ratio of the run-off coefficient ψ<sub>u</sub> independent of previous history and the characteristics of the rainfall (height, intensity, duration). | By supplying a ψ<sub>u</sub>-value the remaining rainfall after having covered the initial losses (wetting and trough losses) generates run-off according to the ratio of the run-off coefficient ψ<sub>u</sub> independent of previous history and the characteristics of the rainfall (height, intensity, duration). | ||
====SCS-Method==== | |||
:''refer to [[SCS-Verfahren|SCS-Method]]'' | |||
==Abflusskonzentration== | ==Abflusskonzentration== | ||
Revision as of 01:27, 6 March 2013
{{#hierarchy-top:}}
Analog to rural catchments the natural process leading from rain to run-off is divided into three phases for urban catchments. The phases are Belastungsbildung, run-off generation (bzw. Belastungsaufteilung) and run-off concentration. The calculation approach for each of these phases is described in the following sections of this article.
Belastungsbildung
Die Belastungsbildung describes the determination of an areal rainfall for the considered catchment.Rainfall data is imported into BlueM via external time series. Therefore no explicit calculations are necessary for this phase.
Run-off Generation
The run-off generation phase determines the amount of rain out of the amount of fallen rain which leads to run-off generation. Rainfall (system load) is divided into rainfall which directly generates run-off and run-off diminishing losses (wetting, trough, evaporation and infiltration losses). Therefore this phase is also called the Belastungsaufteilung. Snowfall is neglected in urban catchments.
In General pervious and impervious areas are calculated separately. Impervious area is calculated through the total area and the fraction of impervious area:
- [math]\displaystyle{ A_{bef} = VG \cdot A_{ges} }[/math]
impervious areas
Effective rainfall for impervious areas is calculated by balancing rainfall, evaporation and the surface reservoir. The surface reservoir is made up of troughs and wetting areas. Troughs and wetting areas are described in more detail in the section "surface water reservoir content". The following equation is derived:
- [math]\displaystyle{ Nw(t) = N(t) - VP(t) - \frac{dO}{dt} }[/math]
- with:
- NW = run-off generating rainfall
- N = rainfall
- VP = potential evaporation
- O = surface water reservoir content
The run-off coefficient of impervious areas is generally set to ψ = 1. Therefore all remaining water - after having covered initial losses - contributes to surface run-off. It needs to be noted that not all impervious areas drain into the canalization. Typically about 10-20% of impervious areas do not drain into the canalization.
pervious areas
For pervious areas the run-off coefficient is ψ <= 1. This is due to the fact, that not all remaining water -after having covered initial losses - contributes to surface run-off on pervious areas. Infiltration is taken into consideration by applying a run-off coefficient <1. ψ can be supplied by the user or can be calculated via the SCS-Method. The equation for momentary load distribution is as follows:
- [math]\displaystyle{ Nw(t) = N(t) - VP(t) - I(t) - \frac{dO}{dt} }[/math]
- with:
- NW = run-off generating rainfall abflusswirksamer
- N = rainfall
- VP = potential evaporation
- I = infiltration into the soil
- O = surface water reservoir content
In the following segments the losses are described in further detail:
Evaporation
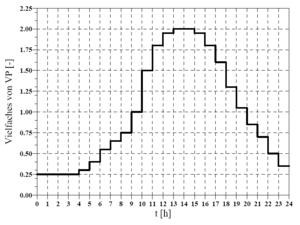
There are two possibilities for the input of potential evaporation. Both options calculate a daily evaporation value. If the chosen time step for the calculation is < 1 day the potential evaporation for each time step is calculated by taking the daily pattern depicted in Abbildung 34 into consideration. If the chosen time step is ≥ 1 day the daily pattern is disregarded.
a) annual evaporation

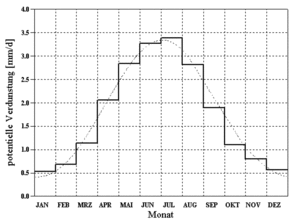
A normed annual pattern of potential evaporation according to Brandt[1] is utilized for the calculation of potential evaporation. Through the evaluation of measurements from twenty different stations, whichs mean-values are depicted as a histogram in Abbildung 33, the following smoothing function was derived (doted line in Abbildung 33):
- [math]\displaystyle{ VP[\mbox{mm/d}] = \begin{cases}(0.96 + 0.0033 \cdot i) \cdot \sin(\frac{2 \pi}{365})(i - 148) + 1.58, & i \lt = 300 \\ 2.56 - 1.53 / 65. \cdot (i - 300.), & i \gt 300 \end{cases} }[/math]
- with
- i = ongoing day of the hydrological year
- i = 1 → 1. November
Potential evaporation according to Brandt refers to grass reference evaporation[2] and assumes an annual total evaporation loss of 654,282 mm. If a different annual total evaporation loss is entered, the value determined by Brandt is scaled accordingly.
b) evaporation time series
If a evaporation time series is supplied the utilized time step is imported.
Attention: For time steps < 1 day the time series value is additionally overprinted with a daily pattern! (Bug 1)
Surface water reservoir content
impervious areas
A change in the surface water reservoir content dO/dt represents filling and depletion of water ( through evaporation) in troughs.
The wetting loss (BV) for impervious areas is set to the following standard value.
BV = 0.5 mm
Trough loss (MV) is set by the user in the ALL-File.
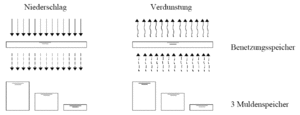
The trough loss is the mean value for an inclined surface. Due to the fact that troughs are not evenly distributed and experience has shown that run-off occurs before all troughs are completely filled the following assumption is made, that:
- 1/3 of the impervious area has a reduced trough loss of 1/3 MV
- 1/3 of the impervious area has a mean trough loss of 3/3 MV
- 1/3 of the impervious area has a elevated trough loss of 5/3 MV
. Therefore run-off occurs as soon as the rainfall (reduced by evaporation) is greater than wetting losses and 1/3 of the trough losses (in dry antecedent conditions). In Abbildung 35 the assumptions are depicted schematically.
Wetting and trough losses are continuously made available through the ongoing balancing of these reservoirs and evaporation.
pervious areas
Surface water reservoir content is determined through the ongoing balancing of a loss reservoir in dependency of the chosen run-off generation approach. Details can be found in the following sections about calculation of infiltration respectively run-off generating rainfall.
Infiltration
Infiltration respectively run-off generating rainfall I(t), Nw(t)
Infiltration into the soil can not be neglected for pervious areas due to the fact that infiltration substantially influences run-off. Three approaches were implemented in the model for the calculation of infiltration:
- constant run-off coefficient ψ
- event specific run-off coefficient similar to the method of the Soil-Conservation-Service (SCS)
constant run-off coefficient ψ
By supplying a ψu-value the remaining rainfall after having covered the initial losses (wetting and trough losses) generates run-off according to the ratio of the run-off coefficient ψu independent of previous history and the characteristics of the rainfall (height, intensity, duration).
SCS-Method
- refer to SCS-Method
Abflusskonzentration
Die Abflusskonzentration bestimmt die Verzögerung des Oberflächenabflusses aus dem Einzugsgebiet. Interflow und Basisabfluss werden bei urbanen Einzugsgebieten nicht berücksichtigt, da die kanalisierten Flächen als Teil des Entwässerungssystems ausschließlcih Oberflächenwasser in der Kanalisation weiterleiten.
Die Berechnung des Oberflächenabflusses erfolgt mit Hilfe einer Parallelspeicherkaskade mit jeweils drei Speichern. Der abflusswirksame Niederschlag des Gesamtgebiets wird durch Mittelwertbildung über die befestigten und unbefestigten Flächen berechnet. Die Aufteilung auf die beiden Speicherkaskaden erfolgt an Hand der Größe des Einzugsgebiets, die Retentionskonstanten der Speicher an Hand der Fließzeit im Einzugsgebiet (siehe Ostrowski et al. (1998)[3]).
Literaturangaben
- ↑ 1.0 1.1 Brandt, T. (1979): Modell zur Abflussgangliniensimulation unter Berücksichtigung des grundwasserbürtigen Abflusses, Technischer Bericht Nr. 24 aus dem Institut für Wasserbau, Fachgebiet Ingenieurhydrologie und Hydraulik der TH Darmstadt
- ↑ DVWK (Hrsg.) (1996): Ermittlung der Verdunstung von Land- und Wasserflächen, DVWK-Merkblätter zur Wasserwirtschaft, Heft 238. Bonn: Wirtschafts- und Verlagsgesellschaft Gas und Wasser mbH
- ↑ Ostrowski, M.W., Mehler, R., Leichtfuß, A. (1998): Dokumentation des Schmutzfrachtmodells SMUSI Version 4.0. Darmstadt: Institut für Wasserbau und Wasserwirtschaft, Technische Universität Darmstadt
{{#hierarchy-bottom:}}

