BlueM.Wave: Difference between revisions
Jump to navigation
Jump to search
(better formatting) |
|||
| Line 37: | Line 37: | ||
* '''Zoom & pan''': Use the mouse to zoom or pan. | * '''Zoom & pan''': Use the mouse to zoom or pan. | ||
* '''Navigation bar''': Use the navigation bar to set a custom display period and to navigate by a fixed time period. | * '''Navigation bar''': Use the navigation bar to set a custom display period and to navigate by a fixed time period. | ||
* | * Quickly switch time series on and off using the '''check boxes''' in the legend. | ||
===Save & Export=== | ===Save & Export=== | ||
Revision as of 08:16, 27 January 2018
 Wave | Download | Development
Description
Wave is a tool for displaying, analyzing and importing and exporting time series.
Features
Supported formats
- WEL (BlueM, GISMO, TALSIM, Hystem-Extran)
- ZRE
- ASC
- SMB
- REG (SMUSI and Hystem-Extran)
- OUT (SWMM binary output files)
- TXT (SWMM routing interface files)
- UVF (Universelles Variables Format)
- Q_Strg.dat and Pegel.dat (HYDRO_AS-2D result files)
- BIN (SYDRO binary format)
- ZRXP (ZXRP format)
- and generic text files (e.g. CSV)
Use a Wave project file (*.wvp) to quickly import multiple series from multiple files at once.
Drag&Drop files onto Wave to import them quickly.
It is also possible to manually input time series, or use copy & paste from Excel.
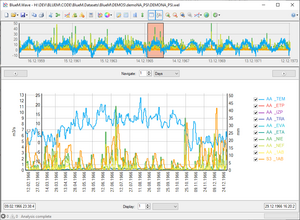
Display time series in a highly customizable diagram (provided by TeeChart)
- Overview: An overview chart shows you the full extent of the time series and the period currently displayed in the main diagram.
- Axes: When importing time series, series are automatically assigned to different axes depending on their unit.
- Zoom & pan: Use the mouse to zoom or pan.
- Navigation bar: Use the navigation bar to set a custom display period and to navigate by a fixed time period.
- Quickly switch time series on and off using the check boxes in the legend.
Save & Export
Save diagrams to the native TeeChart format (TEN-File) to preserve all data and formatting.
Export diagrams as image files (PNG, JPG, BMP)
Export time series to the following formats:
Edit & Analyze
Editing functions:
- Cut time series to a specified time perios or to another series' extent
- Remove error values from a time series
Analysis functions:
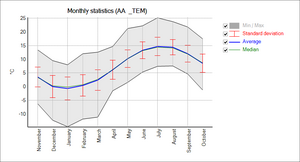
- Monthly statistics
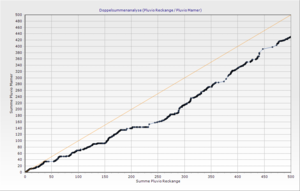
- Double mass curve
- Goodness of fit (volume error, sum of squares error, Nash-Sutcliffe efficiency, etc.)
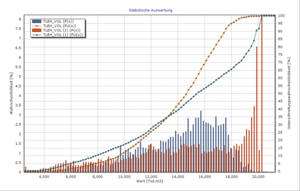
- Histogram
- Comparison: Plot two time series against each other and compute a linear regression line
- Annual statistics: Compute various statistical parameters (min, max, average) of a time series
API
The API is used by BlueM.Opt and BlueM.Win.
See the documentation.
Notes
Importing time series
- "NaN", "Infinity" and "-Infinity" in import files are recognized and accepted.
Unreadable values are converted to NaN.
Values of NaN or +-Infinity are removed before display in the chart and when performing analysis functions.
Downloads
Please refer to the Download page.


