Soil moisture calculation: Difference between revisions
mNo edit summary |
mNo edit summary |
||
| Line 49: | Line 49: | ||
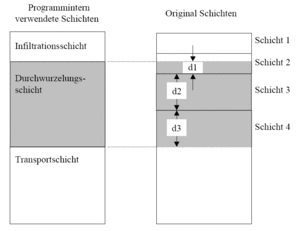
[[Bild:Theorie_Abb38.gif|thumb|300px|Abbildung 38: Example of the aggregation of soil layers for the root layer]] | [[Bild:Theorie_Abb38.gif|thumb|300px|Abbildung 38: Example of the aggregation of soil layers for the root layer]] | ||
The new characteristic soil parameters for the internally used layers are calculated by weighing the original parameters of the original layers according to the original thickness of these layers.Saturated hydraulic conductivity is calculated according to conservation of continuity of the flow. | The new characteristic soil parameters for the internally used layers are calculated by weighing the original parameters of the original layers according to the original thickness of these layers.Saturated hydraulic conductivity is calculated according to conservation of continuity of the flow. For vertical Flow the velocity <code>v</code> is to be constant within a layer for a given flow due to the continuity of the flow. Therefore the hydraulic gradient ist no longer constant. | ||
Bei senkrechter Strömung soll aufgrund der Kontinuität der Strömung die Geschwindigkeit <code>v</code> bei gegebener Durchflussmenge in einer programminternen Schicht denselben Wert besitzen. Damit ist das hydraulische Gefälle nicht mehr konstant. | |||
:<math>k_{f,v} = \frac{\sum d}{\left ( \frac{d_1}{k_1} + \cdots + \frac{d_i}{k_i} + \cdots + \frac{d_n}{k_n} \right )}</math> | :<math>k_{f,v} = \frac{\sum d}{\left ( \frac{d_1}{k_1} + \cdots + \frac{d_i}{k_i} + \cdots + \frac{d_n}{k_n} \right )}</math> | ||
: | :with | ||
:<code>d<sub>i</sub></code> = | :<code>d<sub>i</sub></code> = depth of each original layer [mm] | ||
:<code>k<sub>i</sub></code> = | :<code>k<sub>i</sub></code> = saturated hydraulic conductivity of each original layer [mm/h] | ||
:<code>k<sub>f,v</sub></code> = | :<code>k<sub>f,v</sub></code> = saturated hydraulic conductivity of the internally used layer [mm/h] | ||
The Aggregation of the layers is depicted in [[:Bild:Theorie_Abb38.gif|Abbildung 38]].<br clear="all"/> | |||
== | ==Interception== | ||
In BlueM the Inflow to the interception reservoir (<code>Q<sub>zu<sub>IC</sub></sub></code>)is described as a linear function of the free interception reservoir. | |||
:<math>Q_{zu_{IC}} = k_{IC} \cdot ( \mbox{IC}_{max} - \mbox{IC}_{akt})</math> | :<math>Q_{zu_{IC}} = k_{IC} \cdot ( \mbox{IC}_{max} - \mbox{IC}_{akt})</math> | ||
: | :with:<code>k<sub>IC</sub></code> = 10.0 = Parameter to describe the fill rate of the interception reservoir [1/h] (Bug 409) | ||
:<code>k<sub>IC</sub></code> = 10.0 = Parameter | |||
The maximum interception capacity for agricultural crops is {{:Literatur:Hoyningen-Huene_1983}}: | |||
:<math>\mbox{IC}_{max} = 0.935 + 0.498 \cdot LAI - 0.00575 \cdot LAI^2</math> | :<math>\mbox{IC}_{max} = 0.935 + 0.498 \cdot LAI - 0.00575 \cdot LAI^2</math> | ||
: | :with | ||
:<code>LAI</code> = Leaf Area Index | :<code>LAI</code> = Leaf Area Index [-] | ||
The rate of evaporation is | |||
Die Verdunstungsrate aus dem Interzeptionsspeicher wird immer mit potentieller Rate angenommen (= <code>ET<sub>p</sub></code>). Da der Zufluss gleich dem Niederschlag über der Vegetation minus dem durchfallendem Niederschlag ist, ergibt sich eine einfache lineare Differentialgleichung: | Die Verdunstungsrate aus dem Interzeptionsspeicher wird immer mit potentieller Rate angenommen (= <code>ET<sub>p</sub></code>). Da der Zufluss gleich dem Niederschlag über der Vegetation minus dem durchfallendem Niederschlag ist, ergibt sich eine einfache lineare Differentialgleichung: | ||
Revision as of 07:40, 26 February 2013
{{#hierarchy-top:}}
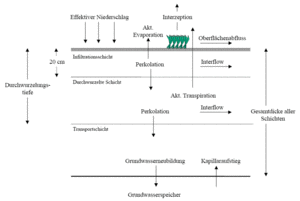
All process-values which are calculated through soil moisture simulation are depicted in the following picture.
Hydrological Response Units (HRUs)
If Runoff is determined through soil moisture simulation, the HRU concept is applied. This results in a catchment being sub-sectioned into a various amount of hydrological homogenous areas.
The depicted assignment of land use and soil type is valid for each HRU. The resulting amount of water out of a HRU is applied at the outlet of the elemt. Therefore all HRUs discharge their Water with the same time delay, independant of their position within the catchment.
Soil moisture calculation is computationally intensive and therefore very time-consuming. This is especially true if there are many HRUs in each sub-catchment. br clear="all"/>
Land use
Providing information on land use is necessary to run the soil moisture calculation. E.g. the thickness of the rooted zone is determined by providing the root depth in the information regarding land use. Furthermore the parameters of land use are needed to calculate interception and transpiration. The parameters are:
- root depth
- soil coverage
- annual pattern of soil coverage
- leaf area index
- annual pattern of the leaf area index
Providing Haude-Coefficients [1][2] is possible by providing an annual pattern and assiging them to the desired land use. This allows for a better consideration of evaporation for each land use.
These Haude-Coefficients scale the valid potential grass reference-evaporation for the time step by their ratio to the corresponding Haude-Coefficient for gras.
Soil type
The soil moisture simulation is based on the non-linear calculation of the individual soil layers. The soil is divided into different soil layers. Each layer is calculated and (if existing) adjusted with the layers above or below. The parameters for the soil moisture calculation are the following physical soil properties:
- wilting point (
WP) - field capacity (
FK) - total pore volume (
GPV) - saturated hydraulic-conductivity (
kf-Wert) - maximum infiltration capacity (
MaxInf) - maximum rate of capillary rise (
MaxKap) - Assignment to a soil type: sand, silt, clay
As few as one or as many as six soil layers are possible. A division into three layers has proven to yield the best results. That is why the entered layers are allways distributed into three layers in BlueM internally.
- infiltration layer (standard thickness = 20 [cm])
- root layer (minimum thickness = 5 [cm])
- transport layer (minimum thickness = 5 [cm])
The new characteristic soil parameters for the internally used layers are calculated by weighing the original parameters of the original layers according to the original thickness of these layers.Saturated hydraulic conductivity is calculated according to conservation of continuity of the flow. For vertical Flow the velocity v is to be constant within a layer for a given flow due to the continuity of the flow. Therefore the hydraulic gradient ist no longer constant.
Bei senkrechter Strömung soll aufgrund der Kontinuität der Strömung die Geschwindigkeit v bei gegebener Durchflussmenge in einer programminternen Schicht denselben Wert besitzen. Damit ist das hydraulische Gefälle nicht mehr konstant.
- [math]\displaystyle{ k_{f,v} = \frac{\sum d}{\left ( \frac{d_1}{k_1} + \cdots + \frac{d_i}{k_i} + \cdots + \frac{d_n}{k_n} \right )} }[/math]
- with
di= depth of each original layer [mm]ki= saturated hydraulic conductivity of each original layer [mm/h]kf,v= saturated hydraulic conductivity of the internally used layer [mm/h]
The Aggregation of the layers is depicted in Abbildung 38.
Interception
In BlueM the Inflow to the interception reservoir (QzuIC)is described as a linear function of the free interception reservoir.
- [math]\displaystyle{ Q_{zu_{IC}} = k_{IC} \cdot ( \mbox{IC}_{max} - \mbox{IC}_{akt}) }[/math]
- with:
kIC= 10.0 = Parameter to describe the fill rate of the interception reservoir [1/h] (Bug 409)
The maximum interception capacity for agricultural crops is von Hoyningen-Huene (1983)[3]:
- [math]\displaystyle{ \mbox{IC}_{max} = 0.935 + 0.498 \cdot LAI - 0.00575 \cdot LAI^2 }[/math]
- with
LAI= Leaf Area Index [-]
The rate of evaporation is
Die Verdunstungsrate aus dem Interzeptionsspeicher wird immer mit potentieller Rate angenommen (= ETp). Da der Zufluss gleich dem Niederschlag über der Vegetation minus dem durchfallendem Niederschlag ist, ergibt sich eine einfache lineare Differentialgleichung:
- [math]\displaystyle{ \frac{\mbox{dIC}}{\mbox{d}t} = k_{IC} \cdot ( \mbox{IC}_{max} - \mbox{IC}(t)) - ET_p }[/math]
Durchfallender Niederschlag ergibt sich danach aus der Differenz zwischen dem Niederschlag auf die Vegetation und der Interzeption.
Obwohl der Ansatz aus Untersuchungen von landwirtschaftlichen Nutzpflanzen abgeleitet wurde, wird seine Gültigkeit vereinfacht auch für bewaldete Gebiete angenommen.
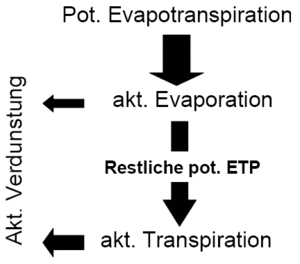
Im Weiteren wird die Interzeptionsverdunstung berechnet. Die ermittelte Interzeptionsverdunstung wird von der potentiellen Verdunstung abgezogen, so dass für die weiteren Prozesse Transpiration und Evaporation nur diese reduzierte potentielle Verdunstung zur Verfügung steht.
Bodenfeuchteberechnung
Auf der Basis der bereichsweisen linearen Abbildung der die Bodenfeuchte beeinflussenden Prozessfunktionen Infiltration, Evaporation, Transpiration, Perkolation, Interflow und Kapillaraufstieg wird für eine Bodenschicht die Wasserbilanzgleichung gelöst. Die Eingangsgröße für die Evaporation und Transpiration ermittelt sich aus der durch die Interzeptionsverdunstung reduzierte potentiellen Verdunstung.
Die zu lösende Gleichung ist:
- [math]\displaystyle{ \frac{d\theta(t)}{d\mbox{t}} = \mbox{Inf}(t) - \mbox{Perk}(t) - \mbox{Eva}_{akt}(t) - \mbox{Trans}_{akt}(t) - \mbox{Int}(t) + \mbox{Kap}(t) }[/math]
- mit:
θ(t)= aktuelle BodenfeuchteInf(t)= Infiltration in den BodenPerk(t)= Perkolation (Durchsickerung)Evaakt(t)= aktuelle EvaporationTransakt(t)= aktuelle TranspirationInt(t)= InterflowKap(t)= Kapillaraufstieg
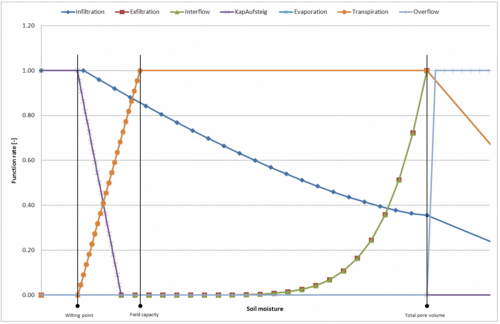
Infiltration, Perkolation, Evaporation, Transpiration, Interflow und Kapillaraufstieg sind von der aktuellen Bodenfeuchte abhängig. In der Simulation wird diese Abhängigkeit durch folgende Funktionsverläufe beschrieben.
- mit:
kf= Durchlässigkeitsbeiwert des gesättigten BodensnFK= nutzbare Feldkapazität (nFK = FK - WP)WP= WelkepunktFK= FeldkapazitätGPV= gesamtes PorenvolumenI= Gefälle [-]fPK= bodenabhängiger Skalierungsfaktor der PerkolationsfunktionfEva= bodenabhängiger Skalierungsfaktor der EvaporationsfunktionfTP= bodenabhängiger Skalierungsfaktor der Transpirationsfunktionf1,Int= bodenabhängiger Skalierungsfaktor für die Interflowfunktionf2,Int= bodenabhängiger Skalierungsfaktor für die InterflowfunktionnInt= bodenabhängiger Krümmungsparameter der InterflowfunktionnTP= Krümmungsparameter der Transpirationsfunktion
Die Programmparameter werden intern berechnet. Der Anwender muss lediglich die Bodenkennwerte kf, WP, FK und GPV angeben.
Die Simulation erfolgt mit einem neu entwickelten Baustein zur Simulation von Speichern, deren Prozessfunktionen bereichsweise linear abzubilden sind.
Infiltration
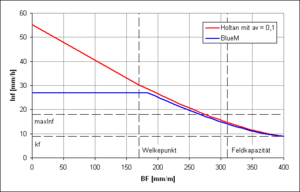
Der ursprüngliche Ansatz nach Holtan (1961)[4]:
- [math]\displaystyle{ \mbox{Inf}(\theta(t)) = \mbox{a}_v \cdot \left ( \mbox{GPV} - \theta(t) \right )^{1,4} + k_f }[/math]
- mit
av= Vegetationsparameter (zwischen 0,1 und 1,0)
wird in BlueM in modifizierter Form angewandt:
- [math]\displaystyle{ \mbox{Inf}(\theta(t)) = \begin{cases} \mbox{MaxInf} + k_f, & 0 \lt \theta(t) \lt 0,1 \cdot \mbox{nFK} \\ \mbox{MaxInf} \cdot \left( \frac{\mbox{GPV} - \theta(t)}{\mbox{GPV} - 0,1 \cdot \mbox{nFK}} \right) ^{1,4} + k_f, & \theta(t) \ge 0,1 \cdot \mbox{nFK} \end{cases} }[/math]
wobei zu beachten ist, dass diese Funktion lediglich die potentielle Infiltration beschreibt - die tatsächliche Infiltration wird durch den zur Verfügung stehenden Bestandsniederschlag beschränkt. Die Modifizierung ergibt sich aus der Überlegung, dass bei einem sehr trockenen Boden auf den es regnet, die im Boden vorhande Luft nicht entweichen kann und somit die maximale Infiltration limitiert, sodass dieses nicht weiter exponentiell ansteigt, wie nach dem ursprünglichen Ansatz nach Holtan ("Blumentopfeffekt").
Perkolation
- [math]\displaystyle{ \mbox{Perk}(\theta(t)) = \begin{cases} 0, & \theta(t) \le \mbox{f}_{PK} \cdot \mbox{nFK} + \mbox{WP} \\ k_f \cdot \left ( \frac{\theta(t) - \left ( \mbox{f}_{PK} \cdot \mbox{nFK} + \mbox{WP} \right )}{\mbox{GPV} - \left ( \mbox{f}_{PK} \cdot \mbox{nFK} + \mbox{WP} \right )} \right )^{n_{PK}}, & \theta(t) \gt \mbox{f}_{PK} \cdot \mbox{nFK} + \mbox{WP} \end{cases} }[/math]
- → zu modifizieren in Ansatz nach van Genuchten
Interflow
Der Interflow ist relativ unabhängig von den Bodenparametern und hängt neben der Bodenfeuchte lediglich vom Gefälle der jeweiligen Elementarfläche ab (siehe Bug 28):
- [math]\displaystyle{ \mbox{Int}(\theta(t)) = \begin{cases} 0, & \theta(t) \le \mbox{f}_{1,Int} \cdot \mbox{nFK} \\ \theta(t)^{\mbox{n}_{Int}} \cdot \frac{I}{\sqrt{1+I^2}}, & \mbox{f}_{1,Int} \cdot \mbox{nFK} \lt \theta(t) \le \mbox{f}_{2,Int} \cdot \mbox{nFK} \\ \mbox{f}_{2,Int} \cdot \mbox{nFK}, & \theta(t) \gt \mbox{f}_{2,Int} \cdot \mbox{nFK} \end{cases} }[/math]
Evaporation
Für die Bodenverdunstung wird die an die Landnutzung angepasste, potentielle Verdunstung auf eine potentielle Verdunstung für Brachland umgerechnet.
- [math]\displaystyle{ \mbox{Eva}(\theta(t)) = \begin{cases} 0, & \theta(t) \le \mbox{WP} \\ \mbox{f}_{Eva} \cdot \left ( \frac{\theta(t)-\mbox{WP}}{\mbox{GPV}-\mbox{WP}} \right ), & \theta(t) \gt \mbox{WP} \end{cases} }[/math]
Transpiration
- [math]\displaystyle{ \mbox{Trans}(\theta(t)) = \begin{cases} 0, & \theta(t) \le \mbox{f}_{TP} \cdot \mbox{nFK} + \mbox{WP} \\ \mbox{f}_{TP} \cdot \left ( \frac{\theta(t) - \mbox{f}_{TP} \cdot \mbox{nFK} + \mbox{WP}}{\mbox{GPV} - \mbox{f}_{TP} \cdot \mbox{nFK} + \mbox{WP}} \right )^{n_{TP}}, & \theta(t) \gt \mbox{f}_{TP} \cdot \mbox{nFK} + \mbox{WP} \end{cases} }[/math]
Literaturangaben
- ↑ Haude, W. (1954): Zur praktischen Bestimmung der aktuellen und potentiellen Evapotranspiration. – Mitteilungen des DWD, Bd. 8; Bad Kissingen
- ↑ Haude, W. (1955): Zur Bestimmung der Verdunstung auf möglichst einfache Weise. Mitteilungen des DWD, 2 (11), Bad Kissingen
- ↑ von Hoyningen-Huene, J. (1983): Die Interzeption des Niederschlages in landwirtschaftlichen Pflanzenbeständen. DVWK Schriften, Nr. 57, S. 1 - 53, PDF

- ↑ 4.0 4.1 Holtan, H.N. (1961): A Concept for Infiltration Estimates in Watershed Engineering, U.S. Department of Agriculture, Agricultural Research Service, Bulletin 41-51, p. 25
- ↑ Ostrowski, M. (1992): Ein universeller Baustein zur Simulation hydrologischer Prozesse, Wasser und Boden, Heft 11 (PDF
 )
)
- ↑ Bear, J. (1988): Dynamics of fluids in porous media, American Elsevier Environmental Science Series (books.google.com)
{{#hierarchy-bottom:}}
