Wave:DoubleSumCurve: Difference between revisions
Jump to navigation
Jump to search
m (Froehlich moved page Wave:Doppelsummenanalyse to Wave:DoubleSumCurve) |
(English) |
||
| Line 1: | Line 1: | ||
{{Wave_nav}} | {{Wave_nav}} | ||
[[Bild:Doppelsummenanalyse.png|thumb | [[Bild:Doppelsummenanalyse.png|thumb]] | ||
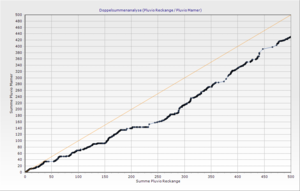
This analysis function plots the cumulative coincident values of two time series against each other and adds a 45° line to the resulting plot. | |||
'''Notes:''' | |||
* The two time series should have the same time step | |||
* Only coincident nodes where both time series values are not NaN are considered | |||
[[Category:BlueM.Wave|D]] | |||
[[Category:Analysis functions|D]] | |||
[[ | |||
Latest revision as of 09:41, 5 June 2020
 Wave | Download | Development
This analysis function plots the cumulative coincident values of two time series against each other and adds a 45° line to the resulting plot.
Notes:
- The two time series should have the same time step
- Only coincident nodes where both time series values are not NaN are considered
