BlueM.Wave: Difference between revisions
Jump to navigation
Jump to search
m (update image captions) |
m (changed link to release notes to point to wiki page) |
||
| Line 51: | Line 51: | ||
==Development== | ==Development== | ||
* [[Wave:Code|Code documentation]] | * [[Wave:Code|Code documentation]] | ||
* [ | * [[Wave:Release Notes|Release Notes]] | ||
* [http://bugs.bluemodel.org/buglist.cgi?bug_status=UNCONFIRMED&bug_status=NEW&bug_status=ASSIGNED&bug_status=REOPENED&content=&product=Wave&query_format=specific&order=bug_severity%2Cpriority%20ASC&query_based_on= Bugzilla:Wave] | * [http://bugs.bluemodel.org/buglist.cgi?bug_status=UNCONFIRMED&bug_status=NEW&bug_status=ASSIGNED&bug_status=REOPENED&content=&product=Wave&query_format=specific&order=bug_severity%2Cpriority%20ASC&query_based_on= Bugzilla:Wave] | ||
[[Category:BlueM.Wave]] | [[Category:BlueM.Wave]] | ||
Revision as of 23:46, 1 March 2017
 Wave | Download | Development
Description
Wave is a tool for importing, exporting, analyzing and displaying time series.
Features
- Import time series:
- WEL (BlueM, GISMO, TALSIM, Hystem-Extran)
- ZRE
- ASC
- SMB
- REG (SMUSI and Hystem-Extran)
- OUT (SWMM binary result files)
- TXT (SWMM Routing interface files)
- UVF (Universelles Variables Format)
- Q_Strg.dat and Pegel.dat (HYDRO_AS-2D result files)
- BIN (SYDRO binary format)
- and generic text files (e.g. CSV)
- Input time series: manual input, or copy & paste from Excel
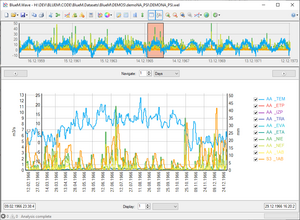
- Display time series in a TeeChart diagram with any number of axes, etc.
- When importing time series, series are automatically assigned to different axes depending on their unit.
- Save diagrams (TEN-File)
- Drag&Drop files onto the form and "Open with ...", or double-click on file (if file extension is associated with Wave.exe)
- Time series overview for navigating through long time series
- API, used by BlueM.Opt and BlueM.Win.
- Export time series:
- Crop time series
- Time series analysis:
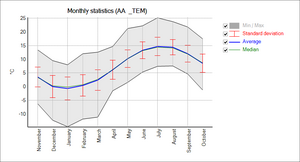
- Monthly statistics
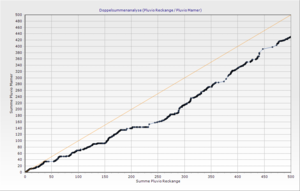
- Double mass curve
- Goodness of Fit (volume error, sum of squares error, Nash-Sutcliffe efficiency, etc.)
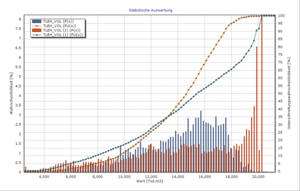
- Histogram
- Plot two time series against each other
Notes
Importing time series
- "NaN", "Infinity" and "-Infinity" in import files are recognized and accepted.
Unreadable values are converted to NaN.
Values of NaN or +-Infinity are removed before display in the chart and when performing analysis functions.
Downloads
Please refer to the Download page.


