Wave:Histogram: Difference between revisions
Jump to navigation
Jump to search
m (Froehlich moved page Wave:Statistik to Wave:Histogram) |
(translate to English) |
||
| Line 1: | Line 1: | ||
{{Wave_nav}} | {{Wave_nav}} | ||
== | ==Description== | ||
[[Bild:Wave Statistik.png|thumb|300px|Screenshot]] | [[Bild:Wave Statistik.png|thumb|300px|Screenshot]] | ||
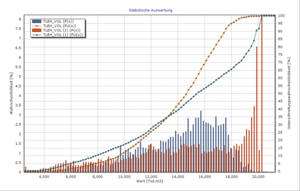
The analysis function '''Histogram''' divides the entire range of values into a series of intervals (bins) and then counts how many values fall into each interval. The result diagram contains the following: | |||
* | * Probability (<code>P(x) = frequency / total amount</code>) | ||
* | * Probability of subceedance (<code>PU(x) = cumulative frequency / total amount</code>) | ||
; | ;Remarks | ||
: | :You can only analyse multiple series at the same time if they use the same unit | ||
==TODO== | ==TODO== | ||
* | * Currently, a fixed number of bins (100) is used. The bins should be user-specified (Bug 397) | ||
[[ | [[Category:BlueM.Wave|H]] | ||
Revision as of 06:47, 6 February 2017
 Wave | Download | Development
Description
The analysis function Histogram divides the entire range of values into a series of intervals (bins) and then counts how many values fall into each interval. The result diagram contains the following:
- Probability (
P(x) = frequency / total amount) - Probability of subceedance (
PU(x) = cumulative frequency / total amount)
- Remarks
- You can only analyse multiple series at the same time if they use the same unit
TODO
- Currently, a fixed number of bins (100) is used. The bins should be user-specified (Bug 397)
