Wave:LinearRegression
 Wave | Download | Development
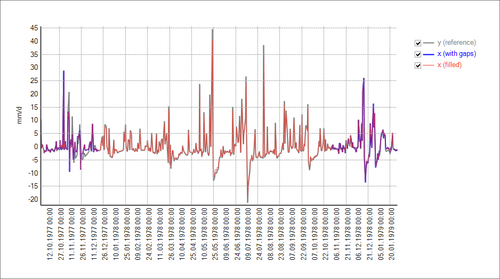
This analysis function fills gaps (NaN values and missing timestamps) in one time series by applying a linear regression relationship with a second time series.
First, a line is fit to the concurrent values of both time series by least-squares fitting the values (x, y) to a line y : x -> a+b*x.
Gaps (NaN values or missing timestamps) in the first time series (x) are then filled using the values of the second time series (y) by applying the equation of the linear regression line.
The filled time series is added to the main diagram with the original title appended with " (filled)". Details about the filled gaps, the equation of the linear regression line and the correlation coefficient are output to the log.
In hydrological applications, when two time series have a correlation coefficient smaller than 0.7, the two time series are not considered to have a linear relationship[1]. In these cases, a corresponding warning is output to the log.
This analysis function is based on the work of Rosskopf (2014)[2]
→ See also the analysis function Comparison, which fits a linear regression line to two time series and displays the results as an x-y plot.
Literature
- ↑ Ostrowski, M.W. (2011): Ingenieurhydrologie I – Vorlesungsskript, Institut für Wasserbau und Wasserwirtschaft, Technische Universität Darmstadt
- ↑ Rosskopf, Tobias (2014): Analyseverfahren hydrologischer Zeitreihen und deren Eignung für die Implementation in BlueM.Wave. Darmstadt, Technische Universität, Bachelor Thesis
