Wave:AnnualRecurrenceProbability
Jump to navigation
Jump to search
 Wave | Download | Development
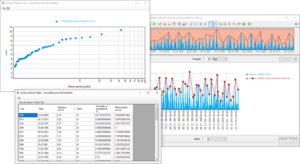
This analysis method calculates the annual recurrence probility and the return period of annual maxima using the Weibull[1] plotting position method.
First, the maximum value in each hydrological year is determined. The probability of recurrence and the return period are then calculated using the following formulas:
[math]\displaystyle{ P = \frac{m}{n+1} }[/math]
and
[math]\displaystyle{ T = \frac{1}{P} }[/math]
where
m: ordered rank of the event (1 = largest event)n: number of total events/yearsP: probability of exceedance [-]T: return period [years]
The analysis results are a result table with all events and their properties, a result chart plotting the return periods and a result series in the main chart containing only the annual maxima.
Notes
- If two or more events have the same maximum value, they are assigned the same rank and thus have the same recurrence probability
Literature
- ↑ Weibull. W. (1939): A statistical theory of strength of materials. Ingeniorsvetenskapsakademiens Handlingar, 151, 1–45
