Wave:AnnualRecurrenceProbability: Difference between revisions
Jump to navigation
Jump to search
(Created page with "{{wave_nav}} thumb|right This analysis method calculates the the annual recurrence probility and the return period of annual maxima using the [https://glossary.ametsoc.org/wiki/Plotting_position Weibull plotting position] method. First, the maximum value in each hydrological year is determined. The probability of recurrence and the return period are then calculated using the following formulas: <math>P = \frac{m}{n+1}</mat...") |
m (Froehlich moved page Wave:AnnualRecurrenceProbabilty to Wave:AnnualRecurrenceProbability: typo) |
(No difference)
| |
Revision as of 06:02, 9 December 2023
 Wave | Download | Development
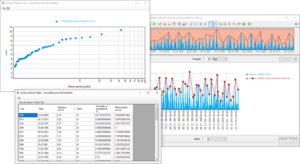
This analysis method calculates the the annual recurrence probility and the return period of annual maxima using the Weibull plotting position method.
First, the maximum value in each hydrological year is determined. The probability of recurrence and the return period are then calculated using the following formulas:
[math]\displaystyle{ P = \frac{m}{n+1} }[/math]
and
[math]\displaystyle{ T = \frac{1}{P} }[/math]
where
m: ordered rank of the event (1 = largest event)n: number of total events/yearsP: probability of exceedance [-]T: return period [years]
The analysis results are a result table with all events and their properties, a result chart plotting the return periods and a result series in the main chart containing only the annual maxima.
Notes
- If two or more events have the same maximum value, they are assigned the same rank and thus have the same recurrence probability
