Wave:Comparison: Difference between revisions
Jump to navigation
Jump to search
(English) |
mNo edit summary |
||
| Line 7: | Line 7: | ||
[[Category:BlueM.Wave]] | [[Category:BlueM.Wave]] | ||
[[Category:Analysis functions]] | [[Category:Analysis functions|C]] | ||
Revision as of 09:24, 5 June 2020
 Wave | Download | Development
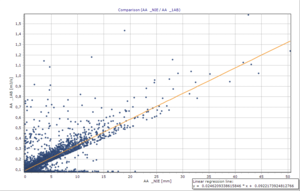
This analysis function plots the concurrent values of two time series against each other and least-squares fits a line to the resulting points.
