Time series management: Difference between revisions
m (remove hierarchy extension template) |
|||
| Line 9: | Line 9: | ||
==Interpretation of time series== | ==Interpretation of time series== | ||
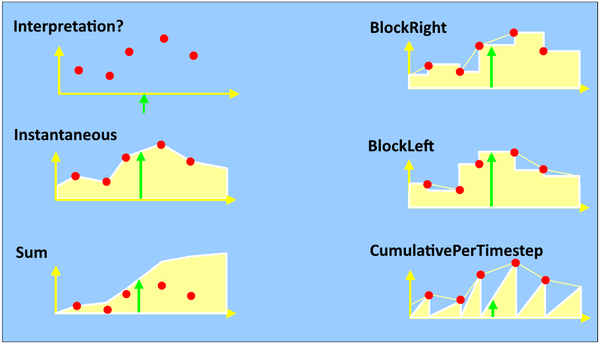
The interpretation of a time series gives vital information about the given time series values respective how the time stamp and the corresponding values are to be understood. | |||
There are five different interpretation types. These types are listed below and depicted graphically in the following figure. | |||
* Instantaneous (e.g. discharge) | |||
* Block right, measured value left | |||
* Block left, measured value right | |||
* Cumulative | |||
* Cumulative per time step (e.g. precipitation) | |||
[[Bild:TimeseriesInterpretation.png|600px|Figure 52: Interpretation of time series]] | |||
Using an incorrect interpretation will inevitably lead to incorrect results. | |||
Precipitation in [mm] is mostly given as cumulative per time step. Discharge [m³/s] may be given as Instantaneous or as BlockRight/BlockLeft, depending on how the measured values were recorded respectively and whether they were averaged over a certain time period. | |||
[[Kategorie:BlueM Theorie]] | [[Kategorie:BlueM Theorie]] | ||
Revision as of 03:17, 6 June 2020
![]() BlueM.Sim | Downloads | Application | Theory | Development
BlueM.Sim | Downloads | Application | Theory | Development
BlueM.Sim theory
The time series management is the interface between BlueM and loads into the considered system. The loads are presented in the form of time series. Basically the are stations to which time series can be assigned, differentiated according to the following types: discharge, precipitation, temperature and content.
BlueM uses its own time series format in binary form (BIN). Furthermore time series in the ZRE-Format can be used.
Interpretation of time series
The interpretation of a time series gives vital information about the given time series values respective how the time stamp and the corresponding values are to be understood.
There are five different interpretation types. These types are listed below and depicted graphically in the following figure.
- Instantaneous (e.g. discharge)
- Block right, measured value left
- Block left, measured value right
- Cumulative
- Cumulative per time step (e.g. precipitation)
Using an incorrect interpretation will inevitably lead to incorrect results.
Precipitation in [mm] is mostly given as cumulative per time step. Discharge [m³/s] may be given as Instantaneous or as BlockRight/BlockLeft, depending on how the measured values were recorded respectively and whether they were averaged over a certain time period.
