BlueM.Wave


Description
Wave is a tool for displaying, analyzing and importing and exporting time series.
Features
 Import time series
Supported file formats:
- BlueM.Sim result files:
*.WEL,*.KWL - DHI MIKE DFS0 format:
*.DFS0 - GISMO result files:
*.WEL - HYBNAT result files:
*.WEL,*.BCS - HYDRO_AS-2D result files:
*.DAT - Hystem-Extran file formats: Regendatei (
*.REG,*.DAT) and Wellendatei (*.WEL) - JAMS result files: JAMS/J2000/J2K/J2000g timeseries results (
*.DAT) - PRMS result files: annual summary, monthly summary, DPOUT (
*.OUT) and statistic variables result file (*.DAT) - SMUSI file formats:
*.ASCresult files and*.REGinput files - SWMM file formats: SWMM5 binary output format (
*.OUT), routing interface files (*.TXT), LID report files (*.TXT), SWMM time series files (*.DAT) - SIMBA file format:
*.SMB - Talsim-NG file formats: time series results (
*.WEL,*.WBL) and binary input time series (*.BIN) - UVF format: Universelles Variables Format (
*.UVF) - ZRE format:
*.ZRE - ZRXP format:
*.ZRX,*.ZRXP - and generic text files (e.g.
*.CSV,*.TXT)
![]() Use a Wave project file (
Use a Wave project file (*.WVP) to quickly import multiple series from multiple files at once.
Drag&Drop files onto Wave to import them quickly.
It is also possible to manually ![]() enter time series, or
enter time series, or ![]() paste clipboard data from Excel and Talsim-NG.
paste clipboard data from Excel and Talsim-NG.
Display time series in a highly ![]() customizable chart (provided by TeeChart)
customizable chart (provided by TeeChart)

 An overview chart shows you the full extent of the time series and the period currently displayed in the main chart.
 Use the toolbar buttons or the mouse to zoom or pan either in the main chart or the overview chart. Use the left mouse button or the mouse scroll wheel to zoom, hold the right mouse button to pan.
 Use the navigation bar to set a custom display period and to navigate by a fixed time period or to the start/end
  .
. Display tabular time series values and optionally show markers
  for selected rows in the main chart
Series management

 Quickly switch time series on and off using the check boxes in the legend or activate/deactivate all series at once using the button in the toolbar.
 Display and edit time series properties in a table with optional statistics.
 Manage axes: When importing time series, series are automatically assigned to different axes depending on their unit.
Save & Export
![]() Save project files (
Save project files (*.wvp) with references to time series from file sources.
![]() Save charts to the native TeeChart format (TEN-File) to preserve all data and formatting (for exceptions, see known issues below).
Save charts to the native TeeChart format (TEN-File) to preserve all data and formatting (for exceptions, see known issues below).
![]() Export charts as image files (PNG, JPG, BMP).
Export charts as image files (PNG, JPG, BMP).
![]() Copy the chart to the clipboard as a PNG image.
Copy the chart to the clipboard as a PNG image.
![]() Export time series to the following formats:
Export time series to the following formats:
Edit & Analyze
Editing functions:
 Cut time series to a specified time period or to another series' extent
 Convert error values of a time series
 Merge multiple time series into one while respecting priorities
![]() Analysis functions:
Analysis functions:
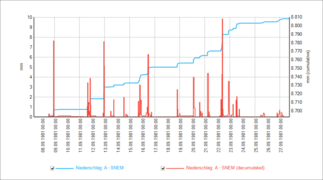
- Accumulate: Compute a new time series that contains the cumulative values of the original series
- Autocorrelation: Autocorrelation analysis for analyzing time series periodicity
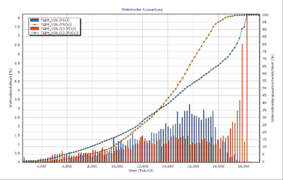
- Annual recurrence probability: Annual recurrence probability of annual maxima using plotting position
- Annual statistics: Compute various statistical parameters (min, max, average) of a time series
- Calculator: Performs a mathematical operation on one or more time series
- Change timestep: Make a time series equidistant with a user-specified timestep
- Comparison: Plot two time series against each other and compute a linear regression line
- Decumulate: Compute a new time series that consists of the decumulated values of the original series
- Double sum curve
- Goodness of fit (volume error, sum of squares error, Nash-Sutcliffe efficiency, etc.)
- Histogram
- Linear regression: Fills gaps (NaN values and missing timestamps) in one time series by applying a linear regression relationship with a second time series
- Monthly statistics
- Timestep analysis: Calculate the timestep between nodes in a user-specified unit
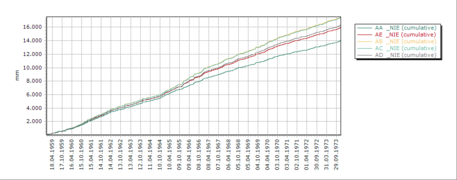
Accumulate
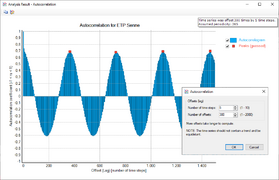
Autocorrelation
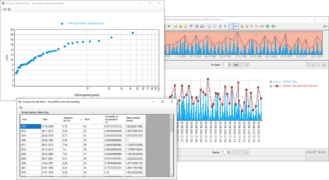
Annual recurrence probability
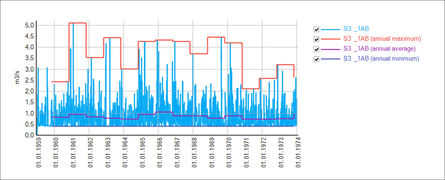
Annual statistics
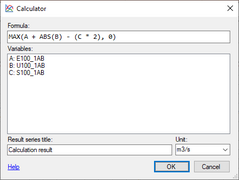
Calculator
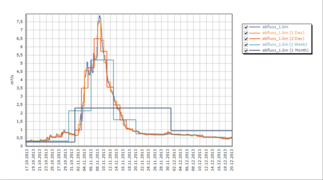
Change timestep
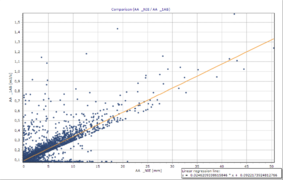
Comparison
Decumulate
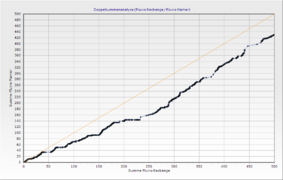
Double sum curve
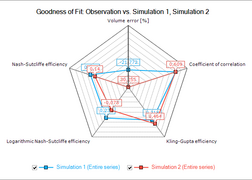
Goodness of fit
Histogram
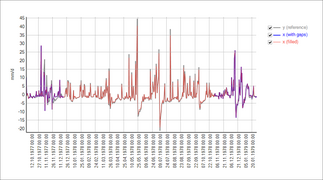
Linear regression
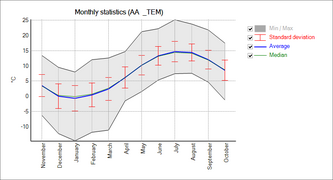
Monthly statistics

Comandline interface
Wave has a commandline interface for importing and converting time series, see Wave:CLI for details.
API
The API is used e.g. by BlueM.Opt and BlueM.Win but allows using Wave from within any .NET project.
See the API docs here: https://bluemodel.github.io/BlueM.Wave/api/
Notes
Error values

- "NaN", "Infinity" and "-Infinity" in import files are recognized and accepted.
- Unreadable values are converted to NaN during import.
- If a file format has a specified error value (e.g. -777 for ZRXP and UVF), then any corresponding entries are also converted to NaN.
- NaN values are displayed as gaps in the chart and are ignored when performing analysis functions.
- Custom, user-specified values can be converted to NaN after import.
- NaN values can be visualized in the chart by pressing a
 button (see screenshot).
Volume property
Wave calculates and displays the Volume property of a time series (e.g. for GoodnessOfFit analysis or in the properties window), if a time series' unit ends with "/s", "/min", "/h" or "/d" (e.g. "m³/s", "mm/h", etc.) and its interpretation is either Instantaneous, BlockLeft or BlockRight, by integrating the values over time while respecting the interpretation. Time series with other units or interpretations only have the Sum property. NaN nodes cause the adjacent timesteps to not contribute to the volume (depends on the interpretation).
Supported date range
Wave supports dates between 01.01.0001 and 31.12.9999.
The chart display can only show dates between 01.01.0100 and 31.12.9000. Time series with dates before 01.01.0100 and after 31.12.9000 are cut for display purposes, but all nodes are still available for analysis and export and are shown in the properties and time series values dialogs. (#68)
Downloads
Download BlueM.Wave from GitHub: https://github.com/bluemodel/BlueM.Wave/releases/latest
Known Issues
- When saving a chart to the native TEN format of TeeChart, certain Timeseries properties such as Interpretation, Datasource and sometimes Unit are lost.
When saving a chart to the native TEN format of TeeChart, any NaN values contained in the series are lost (i.e. the nodes with the NaN values are omitted from the series).fixed in v1.9.1- more issues: https://github.com/bluemodel/BlueM.Wave/issues