BlueM.Wave
Jump to navigation
Jump to search
Description
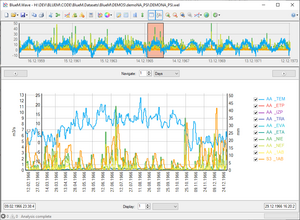
Wave is a tool for reading, analyzing and flexible graphical representation of time series.
Features
- Import time series:
- Time-series type: manual input, or copy & paste from Excel
- Representation of time series in a TeeChart-Diagramm with any number of axes, etc.
- When you import time series, different axes will be distributed automatically based on their series units.
- Save diagrams (TEN-File)
- Drag&Drop files onto the form and "Open with ...", or double-click on file (if file extension is linked with Wave.exe)
- Time series overview,, can be viewed in detail and determined
- Interface, where EVO.NET and BlueM.Win are used.
- Export time series:
- Crop time series
- Time series analysis:
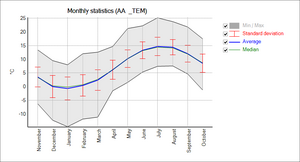
- Months evaluation
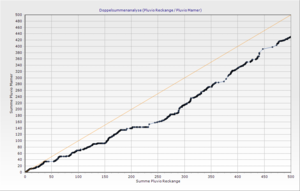
- Double sum analysis
- Goodness of Fit (volume error, sum of squares error, Nash-Sutcliffe efficiency, etc.)
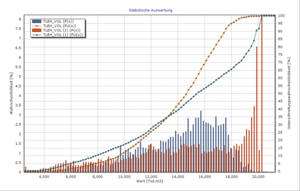
- Statistics
- Comparison of time series
Notes
Importing time series
- WEL and ZRE files have to maintain the format: see WEL, ZRE.
- Column definition: The first column must always contain the data values (x-axis), then from the second column follow the numerical values for one or more time series
- Number format:
- Decimal point should be separated with a punctuation mark (Bug 351)
- "NaN", "Infinity" and "-Infinity" are recognized and accepted from the import files.
Unreadable values when importing are converted to NaN.
For the display and analysis functions nodes with values of NaN or Infinity are removed.
- Date format
TXT, CSV, ASC and WEL → DD.MM.YYYY HH:MMZRE → YYYYMMDD HH:MM


